Developed tools
Infographic Identification in Maps
by Jakub Konicek
#typescript #online
A tool enabling the identification of infographic style in maps through quantifying the graphic expressiveness of its components.
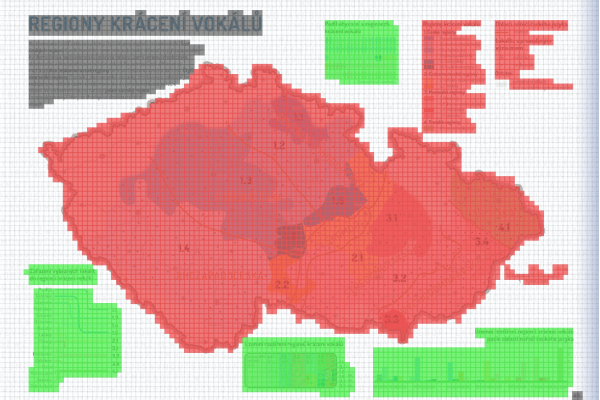
Graphic Map Load Measuring Tool
by Radek Barvíř
#python #gimp #desktop
GMLMT is a plugin for GIMP software providing quantification of graphic map load indicating visual complexity level. This tool can provide average map load value as well as show its distribution over the map canvas or whole map layout to identify overloaded areas to generalise.
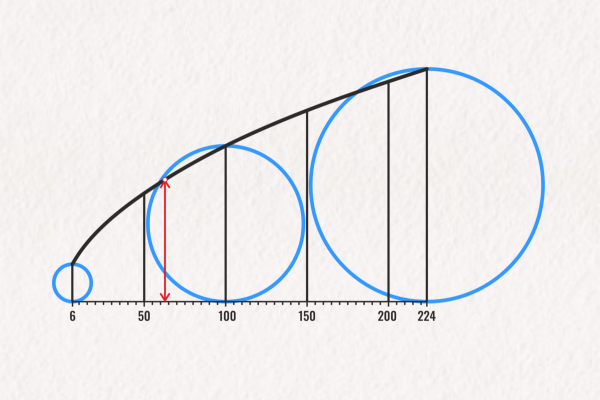
Value-Scale Generator
by Radek Barvíř & Martin Holub
#python #html
The free online tool provides you with a value scale for map legends of proportional-symbol maps according to set parameters. The generated curve represents a function of phenomenon values on x-axis to respective height of map symbols on y-axis for various 2D and 1D symbols. Check also the story behind (in Czech or English).

Tactile Map Talk
by Tomáš Liczka
#java #html #android
Tactile Map Talk is an Andoid appliacation for linking mobile devices with TouchIt 3D multimedial tactile maps with auditive description of interactive map symbols.
You may also check our user manual and online configurator for preparing respective schemes for 3D-printed tactile maps.
Tactile Explore Talk
by Martin Holub & Radek Barvíř
#java #android
Tactile Explore Talk follow-up the original Tactile Map Talk Android app providing more universal platform for both tactile maps and interactive 3D building models. It features from modern architecture and a more user-friendly interface, including a schema editor for individual models.
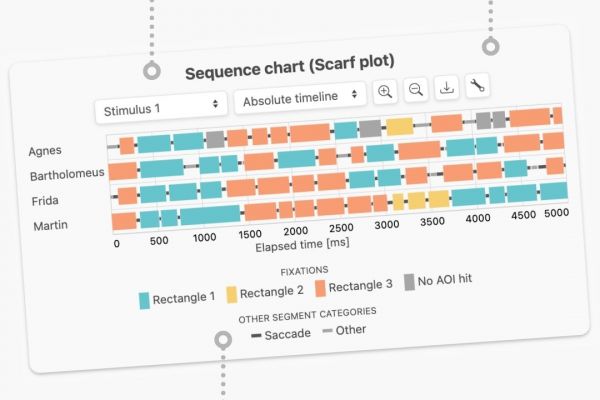
Gazeplotter
by Michaela Vojtěchovská
#typescrip #javascript #css
Gazeplotter is an online tool for visualisation of eye‑tracking sequence charts. You may easily upload data from your eye-tracker software and the app will automatically create an interactive sequence chart (scarf plot) from eye gaze data for free.
Eye-Tracking tools
by S. Popelka, A. Brychtová, O. Štrubl et al.
#html #php #javascript
We developed multiple tools for eye-tracking data conversion & analyses. All the tools are free to use and may help you to automate and visualise the results of various eye-tracking experiments. For each of them, you may check the details and respective documentations on a separate website eyetracking.upol.cz.
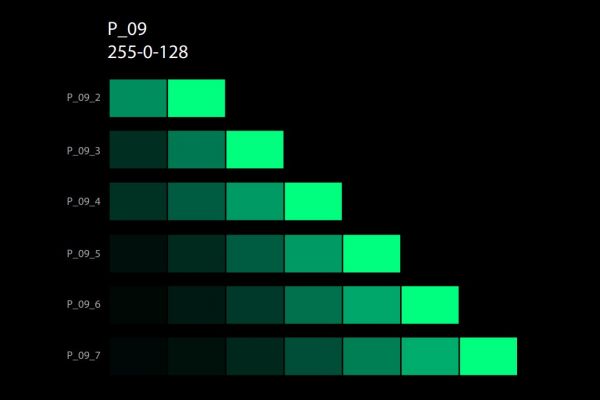
Colour Schemes
by Andrea Hohnová
#html #adobe
The online tool provides a collection of both quantitative and qualitative colour schemes for a variaty of thematic categories. RGB and CMYK codes are also provided.
It has been designed within the bachelors thesis Creating color map scales by cartographic style in 2016.
Tools in development
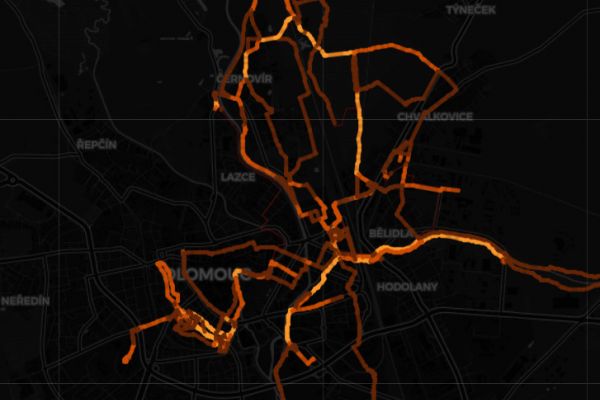
GPX2INTENSITY
by Benjamín Šramo
#python #jupyternotebook
The tool matches GNSS track records in GPX format to the OSM road network calculating frequencies of passages. Therefore, it can be used to process raw mobility data into a form suitable for an intensity map design.
⚠️ This is an experimental and possibly unstable tool (the web appliaction takes a long time to compile). It was developed within the diploma thesis Automation of processing GNSS track records for designing intensity maps.
Shortcuts
ADdRESs
Contact
tel.: +420 585 634 513
fax: +420 585 225 737
geoinformatics@upol.cz
www.geoinformatics.upol.cz